The Mexican peso presents one of the most compelling paradoxes in contemporary emerging market finance. As of February 2026, the currency trades near multi-year highs against the U.S. dollar. Yet virtually every fundamental indicator of economic health tells the opposite story. Manufacturing has contracted for 22 consecutive months. Nearshoring FDI execution runs at roughly five percent of announced commitments. The trade deficit widens under a currency that theory says should make exports competitive. The real effective exchange rate, meanwhile, sits 15 to 20 percent above purchasing power parity equilibrium.
This paper argues that the peso’s strength is not a reflection of Mexican economic fundamentals but rather the product of a self-reinforcing carry trade mechanism that has detached the currency from the real economy it denominates. A 300 to 450 basis point real interest rate differential between Banxico and the Federal Reserve has attracted speculative capital flows exceeding $400 billion in OTC derivatives notional, creating a feedback loop in which strength begets inflows, inflows beget strength, and the resulting overvaluation systematically erodes the productive economy’s competitiveness.
The currency’s resilience is itself the vulnerability. Every day of stability adds to the eventual magnitude of correction.
I. The Paradox
Consider a simple question: what should a country’s currency do when its manufacturing sector contracts for nearly two consecutive years?
The textbook answer is straightforward. Weaker output reduces demand for the domestic currency through lower export receipts, dampened investor confidence, and expectations of monetary easing. The currency depreciates, which in turn restores competitiveness, stimulates exports, and initiates a self-correcting cycle. This is the mechanism described in every international economics textbook from Dornbusch to Obstfeld.
Mexico in 2026 defies this logic entirely.
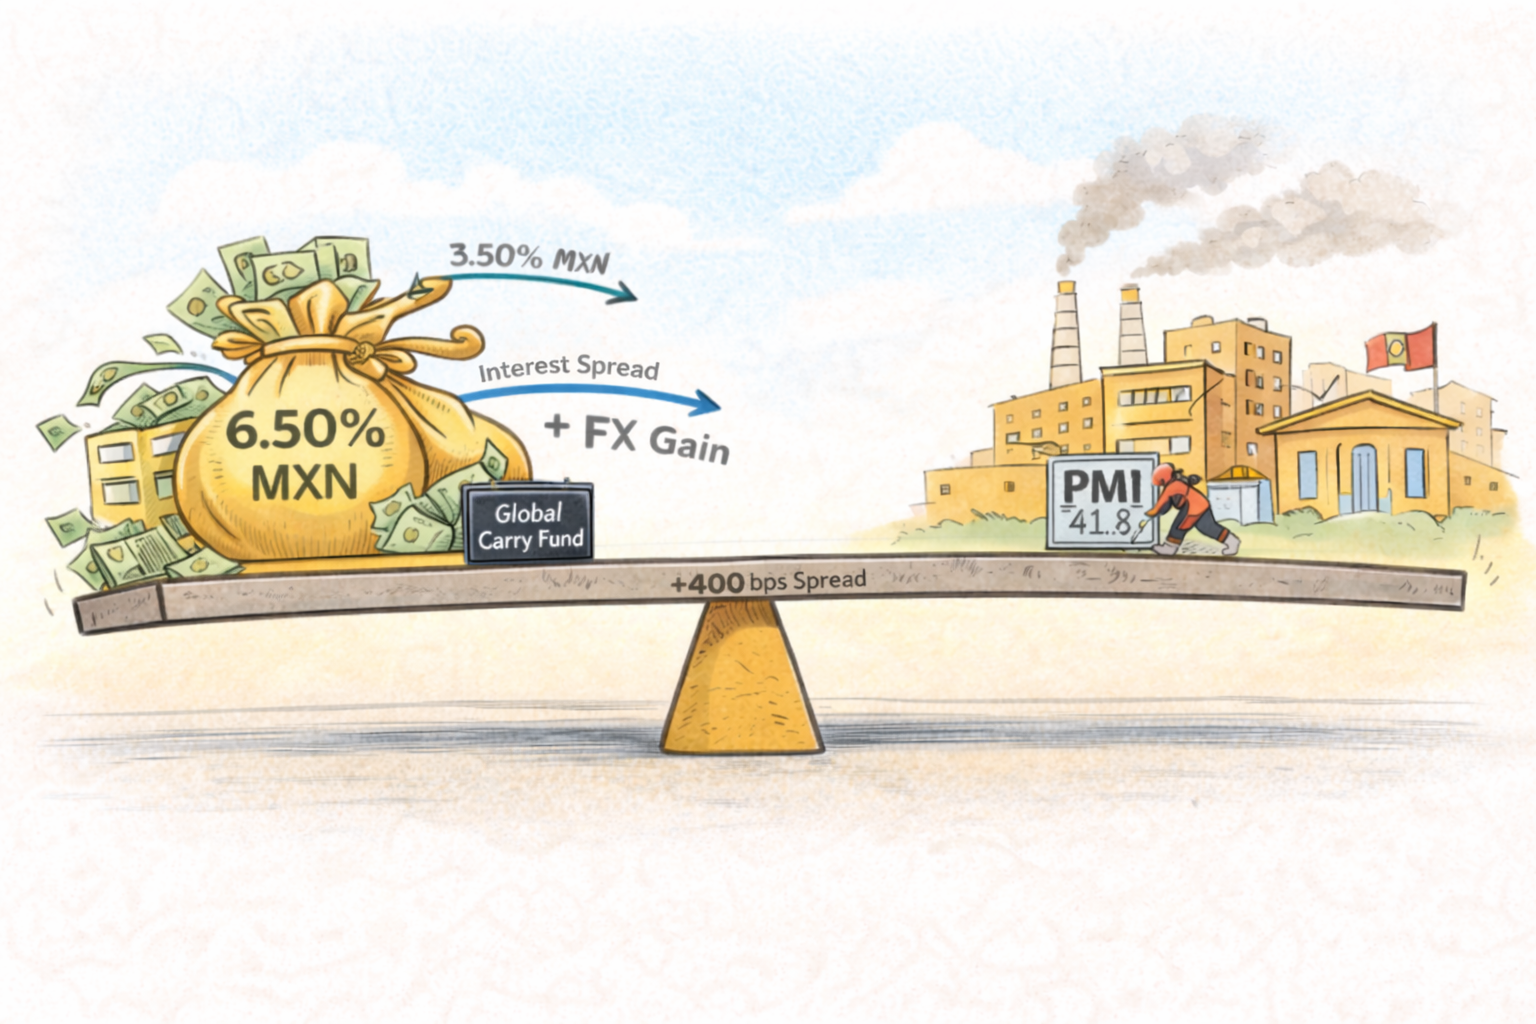
The disconnect between currency strength and economic weakness is not subtle. It manifests across every measurable dimension of the real economy. Industrial production has declined in tandem with the PMI. The trade balance has widened as the overvalued peso prices Mexican exports out of competitive markets while making imports artificially cheap. Unit labor costs, adjusted for productivity, have eroded the wage advantage that made Mexico attractive to manufacturers in the first place. The much-heralded nearshoring pipeline ($170 billion in announced projects) has produced less than $15 billion in actual executed investment, with announcements collapsing 75 percent in 2024 alone.
Yet the peso holds. It does not merely hold; at points it has strengthened. To understand why requires looking not at Mexico’s factories, farms, or export corridors, but at its interest rates, and the global speculative apparatus they have attracted.
II. The Engine: Carry Trade Mechanics
The carry trade is elegant in its simplicity and devastating in its consequences. An investor borrows in a low-yielding currency (say, the U.S. dollar at 3.3 to 3.6 percent) and deposits the proceeds in a high-yielding currency (say, the Mexican peso at 6.50 percent). The spread between the two rates is the “carry,” and for as long as the target currency does not depreciate by more than the rate differential, the trade is profitable.
The mechanism is self-reinforcing. Capital inflows to capture the carry create demand for pesos, which pushes the currency higher, which generates capital gains on top of the interest differential, which attracts more capital. Brunnermeier, Nagel, and Pedersen documented this dynamic formally in their seminal 2008 paper, demonstrating that carry trades systematically build positions during periods of low volatility and unwind violently when volatility spikes.
The scale of speculative positioning in the peso is extraordinary. CFTC data shows net speculative long contracts at multi-year extremes. CME MXN futures daily volume exceeds $50 billion. The OTC derivatives market (forwards, swaps, and non-deliverable forwards) carries notional exposure exceeding $400 billion, a figure that dwarfs Mexico’s entire foreign reserve position of $252 billion.
The Forward Curve Signal: Covered interest parity deviations in MXN forward markets suggest that banks are already pricing tail risk that spot participants ignore. The forward curve is 150 to 200 basis points steeper than the spot rate implies. In effect, derivative markets see the fragility that headline exchange rates obscure.
Banxico’s own $20 billion NDF hedging program, ostensibly a tool of market confidence, can also be read as institutional acknowledgment that the spot rate requires active defense. The program provides forward guidance, but it also represents a finite resource deployed against a market structure orders of magnitude larger.
III. The Rot: Real Economy Divergence
If the carry trade is the engine of peso strength, the real economy is the victim. The Dornbusch overshooting model predicts exactly this pattern: monetary policy differentials cause exchange rates to overshoot their long-run equilibrium, and the resulting misalignment inflicts damage on the tradeable goods sector that persists long after the overshoot corrects.
Mexico’s real effective exchange rate stands 15 to 20 percent above purchasing power parity equilibrium. Rogoff’s updated 2024 evidence on PPP convergence suggests a half-life of three to five years for deviations of this magnitude, and historical data shows that seven of eight comparable EM overshoots since 1990 corrected within 18 to 36 months.
The transmission mechanism is direct. An overvalued currency makes Mexican exports more expensive in world markets while making imports cheaper. The trade balance widens not because of import demand growth (domestic demand is weak) but because exporters lose market share. Unit labor costs rise in dollar terms even as peso-denominated wages stagnate, eroding the comparative advantage that attracted manufacturers to Mexico in the first place.
Fifty-five percent of Mexico’s labor force works in the informal economy. These 70 million workers are excluded from the financial system, receive no productivity gains from foreign investment, and bear the full weight of a strong currency through higher relative prices for domestic goods.
The peso’s strength, in this framing, is a regressive tax: it benefits the financialized north and punishes the subsistence south. It makes single-rate monetary policy structurally inadequate for an economy this bifurcated.
IV. The Plumbing: Capital Flows and Fragility
Most peso analysis examines the surface: spot rates, policy rates, headline FDI. The structural vulnerability, however, lies in the plumbing: the institutional flows, derivative positions, and reserve dynamics that determine how the system behaves under stress.
The visible peso market (CME futures, spot interbank) represents a fraction of total positioning. The OTC derivatives market, encompassing forwards, cross-currency swaps, and non-deliverable forwards, carries notional exposure exceeding $400 billion. These positions are bilateral, opaque, and subject to margin calls that can trigger cascading liquidations during volatility events.
The OTC Iceberg: The ratio of OTC notional to foreign reserves exceeds 1.5 to 1. By Calvo’s measure of capital flow vulnerability, Mexico’s exposure is historically unprecedented.
Institutional positioning: The AFORE pension system, which manages $488 billion in assets, has deployed only 16 percent of its permitted 20 percent foreign allocation. Institutional Mexico is already positioning.
Mexico’s 5-year credit default swap trades at 93.5 basis points, elevated but not alarming in isolation. The concern is what sits beneath the sovereign: Pemex, the state oil company, carries $106 billion in total debt with $12.7 billion maturing in 2026 alone. Oil revenue constitutes 25 percent of federal income at Brent prices near $68 per barrel.
V. Steel-Manning the Bull Case
Intellectual honesty requires presenting the strongest arguments against our thesis and engaging with them seriously. Seven propositions underpin the conventional bull case for the peso. Each contains genuine substance. Each also has a structural limitation that the headline obscures.
The nearshoring narrative deserves particular scrutiny because it has become the cornerstone of peso bullishness, and the gap between promise and execution is the widest of any bull case argument.
Perhaps the most sophisticated articulation of the bull case comes from Everardo Elizondo, former deputy governor of Banco de México, whose February 2025 column “El ‘superpeso’ en perspectiva histórica” argues that the peso’s recent strength is neither anomalous nor unsustainable. Elizondo’s central observation is that the real exchange rate (the nominal rate adjusted for relative inflation between Mexico and the United States) currently sits near its thirty-year arithmetic mean. The three historical spikes in the REER (1994, 2016, 2020) each reflected discrete shocks that reversed once markets absorbed the implications. Manufacturing export growth, he notes, has accelerated since late 2023. The implication is clear: there is no overvaluation to correct.
Elizondo’s analysis deserves serious engagement precisely because it is correct on its own terms. The REER is near its historical average. Export volumes have grown. But the argument has a structural blind spot that our thesis addresses directly: it treats the real exchange rate as an equilibrium indicator without accounting for the composition of flows sustaining it. A REER at its mean supported by productivity gains, FDI execution, and trade surpluses is fundamentally different from a REER at its mean sustained by $400 billion in speculative derivatives notional and a 300–450 basis point carry spread. The former is self-reinforcing; the latter is self-undermining. Elizondo’s thirty-year chart shows precisely the pattern we describe: every period in which the REER appeared “normal” while the underlying flow composition was speculative ended with a violent correction. The mean is not a floor. It is the level from which the divergence begins.
This is not a dismissal of Elizondo’s work but rather an acknowledgment that the debate itself reveals the paradox. Credible, well-reasoned analysts can look at the same REER data and reach opposite conclusions depending on whether they weight the level of the real exchange rate or the fragility of the flows sustaining it. Our thesis is that the latter matters more, and that the market has systematically underpriced it.
The peso’s strongest arguments are simultaneously its deepest vulnerabilities. Credibility attracts carry. Reserves lag notional exposure. Surpluses mask demand destruction. Each bull case, examined fully, reinforces the paradox.
VI. The Precedent: Historical Rhymes
The pattern of carry-fueled currency strength followed by violent correction is not theoretical. It has occurred repeatedly in emerging markets on approximately 8 to 12 year cycles, and Mexico itself provides the archetype.
The 1994 Tequila Crisis and the current environment share four of five structural preconditions: an overvalued currency, carry-funded capital inflows, a political transition, and oil revenue dependency. The fifth precondition in 1994 was a fixed exchange rate peg that concealed the buildup of imbalances until the devaluation was catastrophic, resulting in a 50 percent collapse in the peso’s value.
The JPY Carry Unwind Preview: The August 2024 Bank of Japan rate adjustment triggered a global carry trade unwind that crashed the peso 12 percent in three trading days, with a correlation of 0.72 to the yen’s moves. The MXN carry trade is approximately three times larger by notional than the JPY carry trade was at the point of unwind.
Krasker’s original “peso problem” formulation, later extended by Lewis, describes precisely this condition: a market that prices in the continuation of a stable regime while systematically underweighting the probability of a tail event. The carry trade’s profitability during stable periods creates a selection bias that makes the eventual unwind both more severe and more surprising than rational expectations models predict.
VII. The Spillover: Cross-Border Arbitrage
The peso paradox is not merely an analytical observation. It creates a specific, time-bound arbitrage opportunity for investors who can allocate across the U.S.–Mexico border.
When the peso is strong, Mexican high-net-worth investors possess enhanced purchasing power for U.S. dollar-denominated assets. Every peso buys more square footage in Houston, more yield in U.S. treasuries, more equity in dollar-denominated businesses. The arbitrage is straightforward: convert pesos to dollars during strength windows, acquire real assets, and benefit both from the asset’s intrinsic return and from the currency correction that historical patterns suggest is inevitable.
This is the logic of Denaris Capital’s investment thesis: the peso paradox is not a risk to be hedged but an opportunity to be harvested, provided the allocation is structured in USD-denominated real assets with intrinsic value independent of the currency dynamic.
VIII. The Recursive Doom Loop
We return to where we began, but now equipped with the full mechanism. The peso’s strength attracts carry. Carry reinforces strength. Strength erodes competitiveness. Eroded competitiveness weakens the real economy. A weakened real economy, absent the carry trade, would produce a weaker currency. The carry trade, however, persists, sustaining the overvaluation, deepening the damage, and raising the eventual cost of correction.
This is the recursive doom loop at the heart of the peso paradox. It is not a prediction of imminent crisis. It is a structural diagnosis of a system in which the equilibrating mechanisms have been disabled by speculative flows, and in which every day of apparent stability contributes to the magnitude of eventual instability.
The natural objection is straightforward: why doesn’t a weakening economy force Banxico to cut aggressively, collapsing the spread and breaking the loop? The answer lies in what Calvo and Reinhart formalized as “fear of floating.” Mexico’s exchange rate pass-through to inflation remains elevated, estimated at 0.15 to 0.20 within four quarters, meaning that every percentage point of depreciation feeds directly into consumer prices. With services inflation still running above target and the fiscal deficit widening, aggressive easing risks triggering precisely the disorderly depreciation it seeks to avoid. The central bank’s constraint set thus prevents the equilibrating policy response: even as growth weakens, Banxico cannot cut fast enough to kill the carry without risking a currency crisis that would be worse than the disease. The spread persists longer than fundamentals justify not because policymakers are unaware of the paradox, but because they are trapped within it.
The question is not whether the peso corrects. The question is whether you are positioned on the right side of the correction when it comes.